2.3 The Basics
In order to create a plot, you:
- Call the
ggplot()function which creates a blank canvas - Specify aesthetic mappings, which specifies how you want to map variables to visual aspects. In this case we are simply mapping the displ and hwy variables to the x- and y-axes.
- You then add new layers that are geometric objects which will show up on the plot. In this case we add
geom_pointto add a layer with points (dot) elements as the geometric shapes to represent the data.
# create canvas
ggplot(mpg)
# variables of interest mapped
ggplot(mpg, aes(x = displ, y = hwy))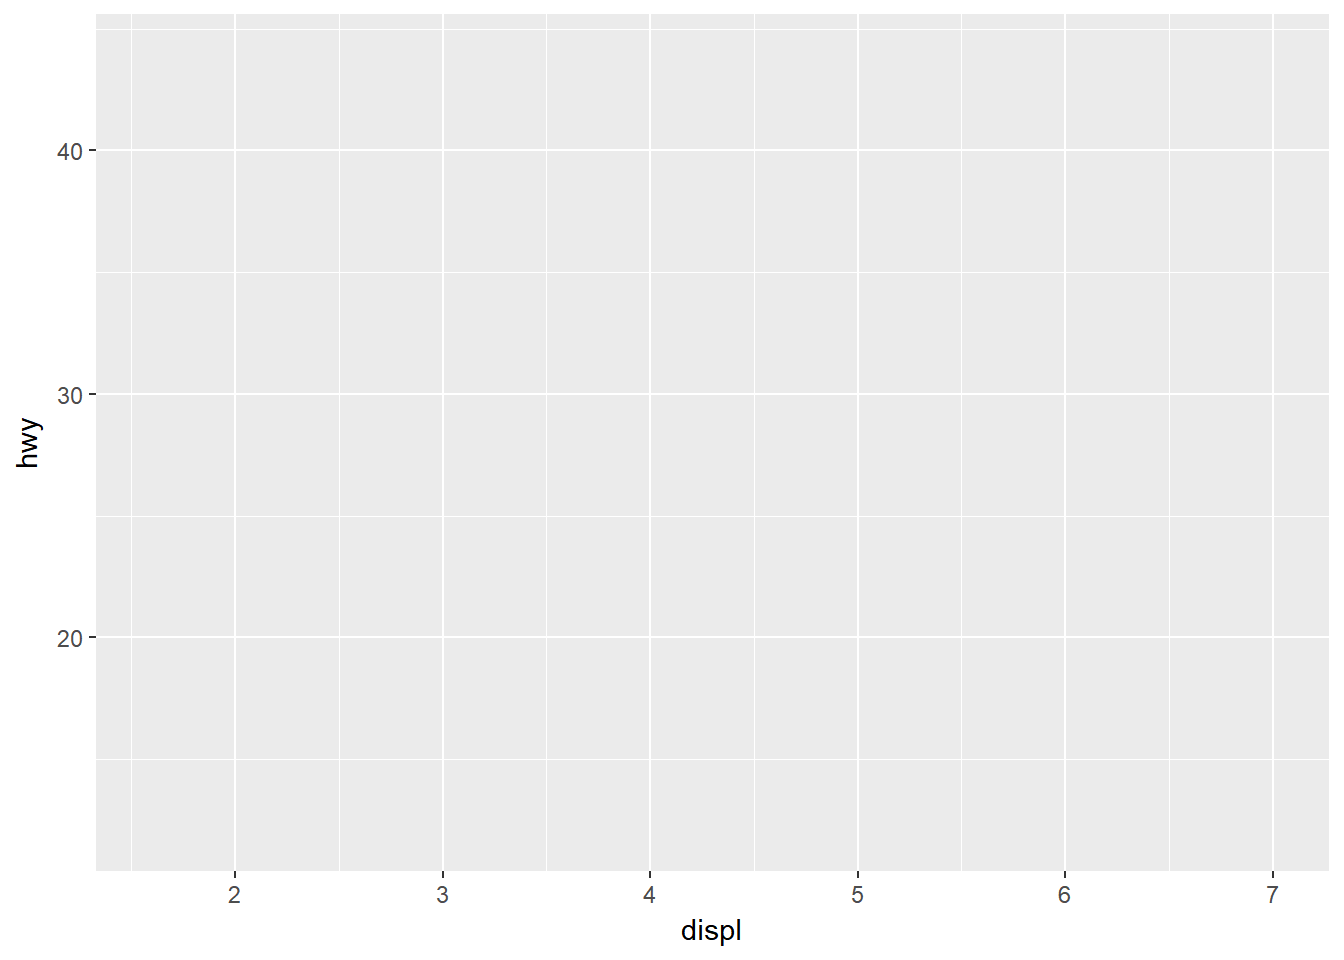
# data plotted
ggplot(mpg, aes(x = displ, y = hwy)) +
  geom_point()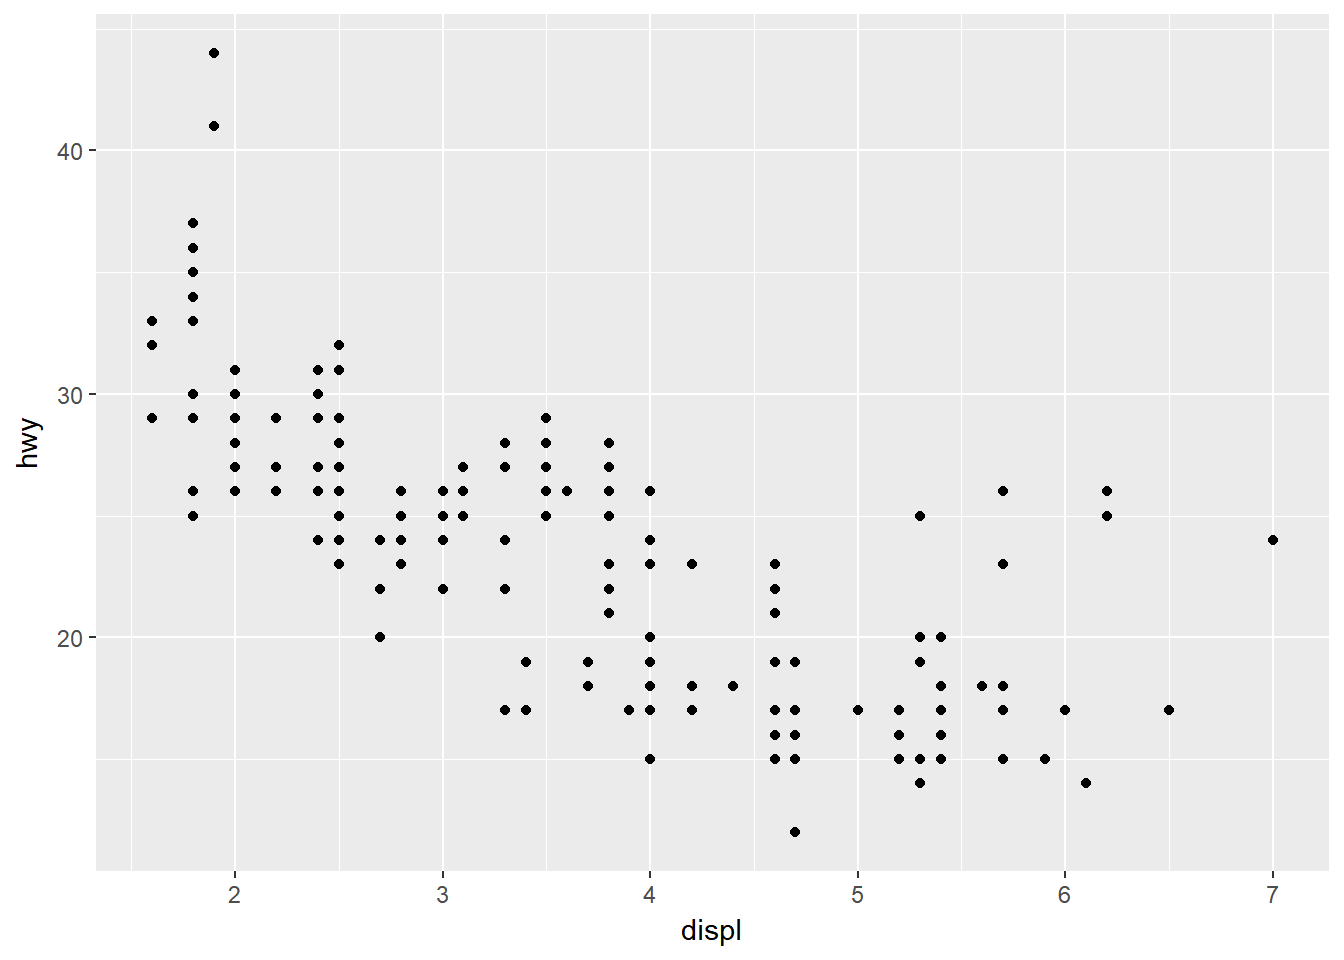
Note that when you added the geom layer you used the addition (+) operator. As you add new layers you will always use + to add onto your visualization.